Written by Timothy Cheng, Senior Consultant and Strategic Lead for DEI Services, TSIC
This is the first of a series of two blog posts about the reflection from the Resolve Community Scorecard project.
In 2022, I moved from Hong Kong to the United Kingdom. In Hong Kong, I am male, ethnic Chinese, part of the 95% majority, and graduated from both of the top two universities in Hong Kong. I had spent years working on diversity, equity, and inclusion, working with various marginalised communities and thinking carefully about what inclusion looks like. I understood it intellectually. Then I moved, and I started to understand it differently.
In Hong Kong, if I applied for ten jobs, I would expect to be invited to interview for most of them. In the UK, I might hear back from two. I noticed that people might form an impression of me before I had said a word. Small things accumulated: comments that were probably not intended to sting, interactions that left me wondering whether I had imagined something. I had not moved into financial difficulty. I was not facing discrimination in any legal sense. And yet, something had shifted in how I moved through the world, and in how the world received me.
I share this not to centre my own experience, but because it changed how I approach the question at the heart of a project I led this year with Resolve Foundation: how do we know if a city, Hong Kong in this case, is becoming more inclusive?
Before we can answer that, we have to answer something harder. What does inclusion actually mean?
It is not what most people think
Ask most people what social inclusion means, and they will describe something like access to jobs, services, education, and housing. That is not wrong. But it is incomplete.
Academic literature distinguishes between two broad ways of thinking about inclusion. The first, a rights-based approach, frames exclusion as the deprivation of rights — the failure of society to protect people’s entitlements as citizens. The second, more common in policy circles and in East Asian contexts, is a participation model: inclusion as the opportunity to engage in the key functions of social and economic life.
Most governments and most metrics operate within the participation model. They count who is working, who is in school, and who is accessing healthcare. These things matter. But they do not capture what I experienced in those early months in the UK, which was not a lack of access to services. It was something more subtle: a gap between formal inclusion and felt belonging.
Researchers call this the distinction between objective and subjective dimensions of inclusion (Oxoby, 2009). The objective domain covers material conditions and distributional access to rights and resources. The subjective domain covers how people experience their position in society: their sense of belonging, their trust in institutions, and their feeling of dignity in everyday interactions. Both matter. A society can perform reasonably well on objective measures and still leave significant numbers of people feeling peripheral, invisible, or conditionally welcomed.
Exclusion compounds itself
One of the findings that stayed with me from our desk research is how exclusion works as a system rather than a set of separate problems.
Hills et al. (2002) identified four core properties of social exclusion that help explain why it is so resistant to simple solutions. It is relative: what counts as exclusion depends on the specific society and moment in time. It is multi-dimensional: it encompasses not just poverty but non-participation in economic, civic, and social life. It is dynamic: people can move into and out of exclusion, and the pathways matter as much as the condition. And it has multi-layered causes, from the individual level through to the structural and global.
Filia et al. (2018), in a thematic analysis of 71 pieces of literature, identified 90 separate contributors to social inclusion and exclusion across 13 domains. The key observation was not the length of the list but what the authors called the “interlocking and mutually compounding” nature of these factors. Unemployment makes poor housing more likely. Poor housing compounds health problems. Health problems reduce employment prospects. Each factor can be both a cause and an effect of exclusion. This is why addressing one dimension in isolation rarely produces lasting change, and why measuring one dimension in isolation rarely tells you much about the whole picture.
My own experience was a mild version of this. I did not face compounding disadvantages in the way many marginalised communities do. But even a small taste of how these dynamics work, of how a gap in one area quietly shapes your experience in others, clarified something that years of working on DEI had not quite made concrete.
Inclusion is not the same everywhere
Cross-cultural research adds a further complication: inclusion does not mean the same thing across contexts, and assuming it produces frameworks that miss what matters locally.
A comparison of Singapore and Taiwan (two geographies that are culturally similar to Hong Kong) is instructive and shows clearly that there is no single Asian model of inclusion.
Singapore’s approach is one of state-led nation-building, conceptualised as “managed multiracialism.” The government organises social life around a formal racial classification system and engineers inter-ethnic contact through top-down policies such as ethnic quotas in public housing. Inclusion here is largely prescribed and conditional on conforming to collective norms. Research by Chiu et al. (2016), drawing on focus groups with 51 participants, found that Singaporeans tend to define inclusion as access to basic dimensions of community living, with strong emphasis on government leadership and collective responsibility.
Taiwan’s trajectory differs considerably. Its democratic transition, driven by social movements from the 1980s onwards, embedded civic participation and pluralism into the culture. Civil society frames inclusion through rights, empowerment, and anti-discrimination. The government has voluntarily adopted major international human rights treaties despite diplomatic isolation, and feminist and disability rights movements have expanded the public’s understanding of inclusion well beyond access to services.
Two regions’ contexts, two distinct paths. For Hong Kong, the lesson is not which model to follow but that developing a locally grounded framework matters: one that reflects the city’s own civil society values and specific communities rather than importing assumptions from elsewhere.
So what does genuine inclusion look like?
Researchers who have pushed beyond the access model tend to converge on something like this: genuine inclusion requires both belonging and authenticity at the same time. Belonging means being accepted as part of the group. Authenticity means being able to be fully yourself without masking or minimising aspects of your identity. When either is absent, i.e, when someone is welcomed only on condition that they assimilate, or when they can be themselves but are treated as peripheral, inclusion remains incomplete.
Research on tolerance as a concept suggests that societal progress can be mapped along a spectrum: from prejudice through stereotype and indifference, toward respect, acceptance, and finally appreciation. What strikes me about this spectrum is that most inclusion efforts and most inclusion metrics aim somewhere around the middle. They try to remove formal barriers and increase representation. These are necessary. But they do not, on their own, move a society toward the appreciation end of the spectrum, where difference is not merely tolerated but genuinely valued.
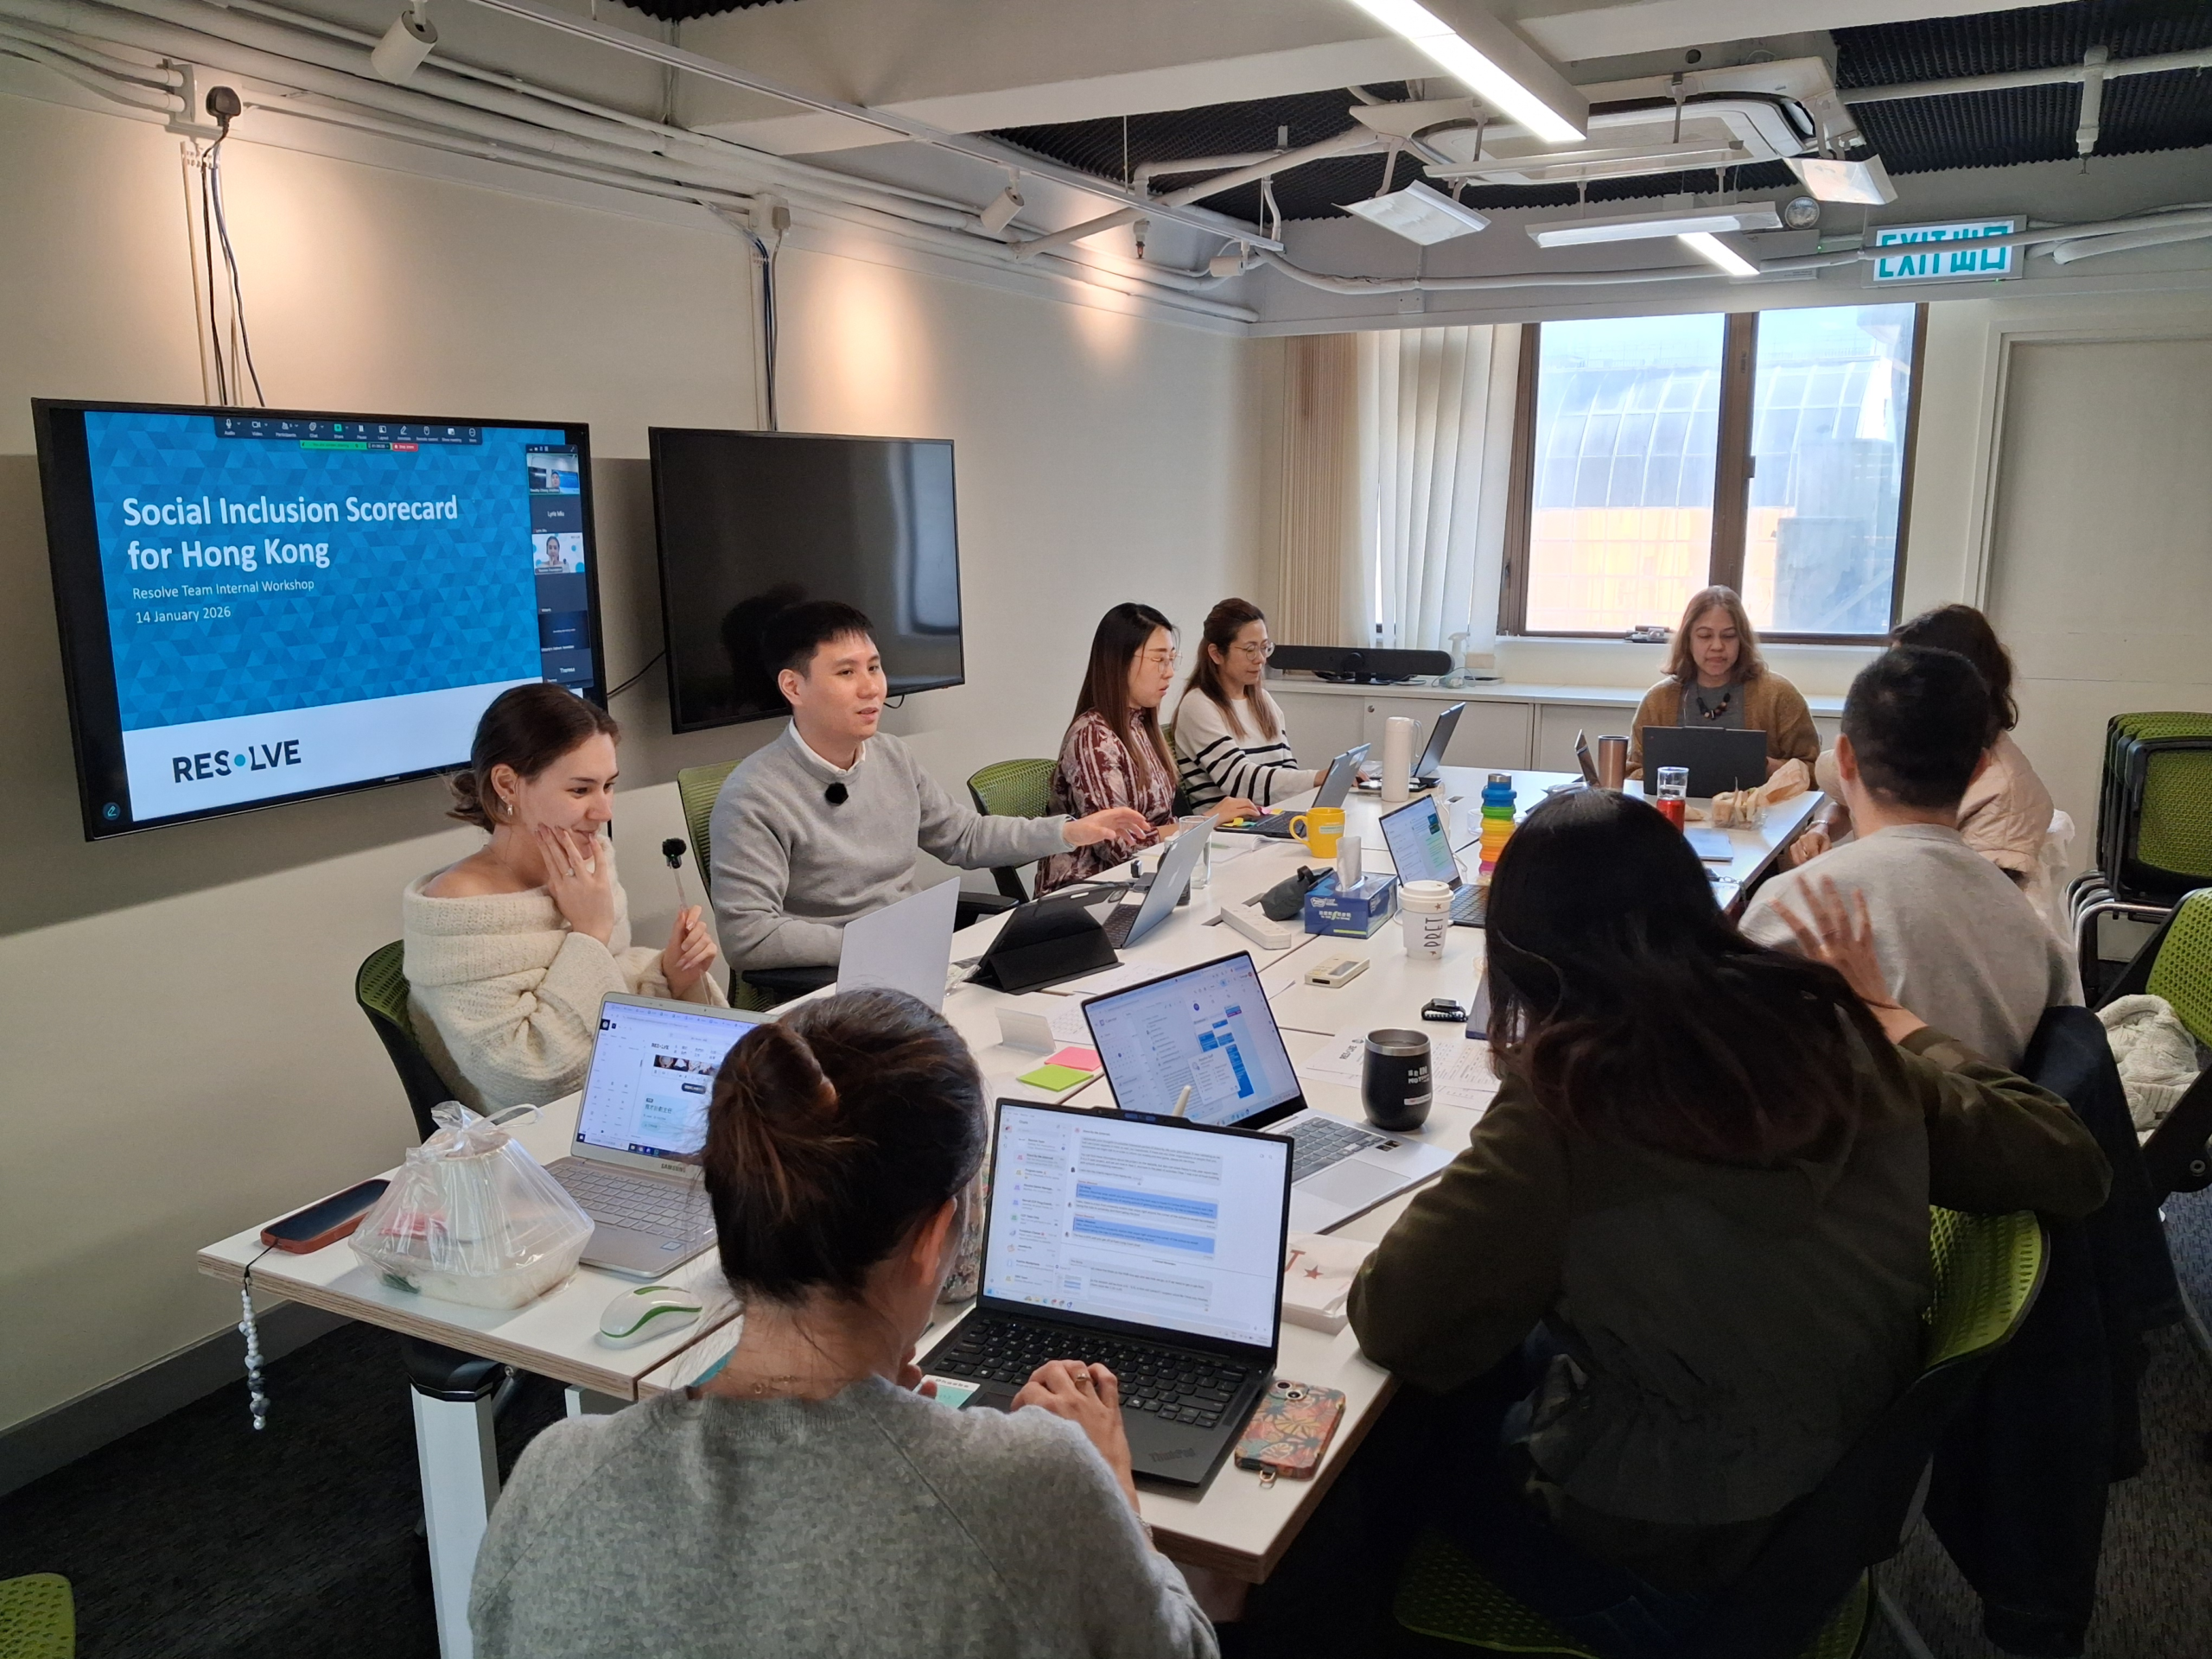
What this meant for the Resolve Community Scorecard
All of this shaped the framework we developed with Resolve. Rather than producing a single composite score, the Resolve Community Scorecard uses a five-level rubric (from Denial through Awareness, Engagement, and Commitment to Transformation) anchored in these conceptual models. It assesses progress across four domains drawn from Resolve’s Theory of Change: freedom from discrimination, equitable outcomes for all groups, diverse representation in public life, and pride in inclusion as a core societal value.
The rubric is designed to be used by a community panel: people with professional, academic, and lived experience of inclusion who review evidence, score independently, deliberate together, and re-score. This meaning-making process with the community is as important as the output. As one practitioner we consulted put it, “the beauty lies in the process of really bringing together people from diverse backgrounds.”
The full methodology is documented in the report Closing the Data Gap: Developing a Framework for Measuring Inclusion in Hong Kong, produced in collaboration with Resolve Foundation. https://resolvehk.org/about-resolve/reports-and-resources/
Getting the definition of inclusion right is not an academic exercise. It determines what you count, what you miss, and what you do about it. My time in the UK gave me a more grounded sense of why that matters. The second post in this series looks at how social inclusion is currently measured, globally and in Hong Kong, and where the gaps are.
If this kind of work connects with what your organisation is trying to do, we would be glad to hear from you.
References
- Chan, K. et al. (2014). A concept mapping study on social inclusion in Hong Kong. Social Indicators Research, 119(1), 121–137. Available at: https://doi.org/10.1007/s11205-013-0498-1
- Chiu, M.Y.L. et al. (2016). What does social inclusion mean to Singaporeans? Asia Pacific Journal of Social Work and Development, 26(2–3), 64–76. Available at: https://doi.org/10.1080/02185385.2016.1218357
- Filia, K.M. et al. (2018). What is social inclusion? A thematic analysis of professional opinion. Psychiatric Rehabilitation Journal, 41(3), 183–195. Available at: https://doi.org/10.1037/prj0000304
- Hills, J. et al. (2002). Understanding Social Exclusion. Oxford University Press.
Oxoby, R. (2009). Understanding social inclusion, social cohesion, and social capital. International Journal of Social Economics, 36(12), 1133–1152